
Basic Charting Course
Intro to the Wyckoff Method
 ON-DEMAND
What will be covered?
This course presents a wealth of foundational chart-reading knowledge, encompassing both Technical Analysis (TA) and the Wyckoff Method. You will learn elemental to intermediate charting principles, including our personal interpretations of conventional (TA) concepts within a Wyckoff Method context. The Basic Course focuses on the essential analytical techniques that will allow you to make a seamless transition from TA to the Wyckoff Method!
How will you benefit from these materials?
This course will provide you with a clear understanding of:
- Fundamental concepts in Technical Analysis (TA)
- Core analytical principles of the Wyckoff Method
- Our perspectives of the key differences and areas of complementarity between conventional TA and the Wyckoff Method
When you complete the Basic Course, you will be well prepared for the next steps on the path to mastery of the Wyckoff Method.
Each of the videos has accompanying slides, which can be printed out to allow you to take notes on as you watch the presentations. You will have one full year from the date of purchase to view and review the videos!
Basic Charting Course
Intro to the Wyckoff Method
Basic Charting Course
Original price was: $250.00.$50.00Current price is: $50.00.


CURRICULUM
- Types of Charts: Vertical (aka Bar), Candlestick, Point & Figure (P&F), Candlevolume
- Descriptions and visual explanations of each type, including appropriate usage contexts and benefits
- Vertical bar (+ volume bars) – Tape Reading
- Point-and-Figure – companion to vertical charts, horizontal counts, less price volatility (not time), tape reading, volume
- Candlestick – Basic structure + visualizations
- Candlevolume charts – Combining candlestick + volume
- Descriptions and visual explanations of each type, including appropriate usage contexts and benefits
- Time Frames: intraday, daily, weekly, monthly
- Traditional timeframes and how they are best used. Campaigns (weekly + monthly), swing (daily), intraday (intraday + daily)
- Combining multiple timeframes
- Price and volume patterns are fractal on different time frames
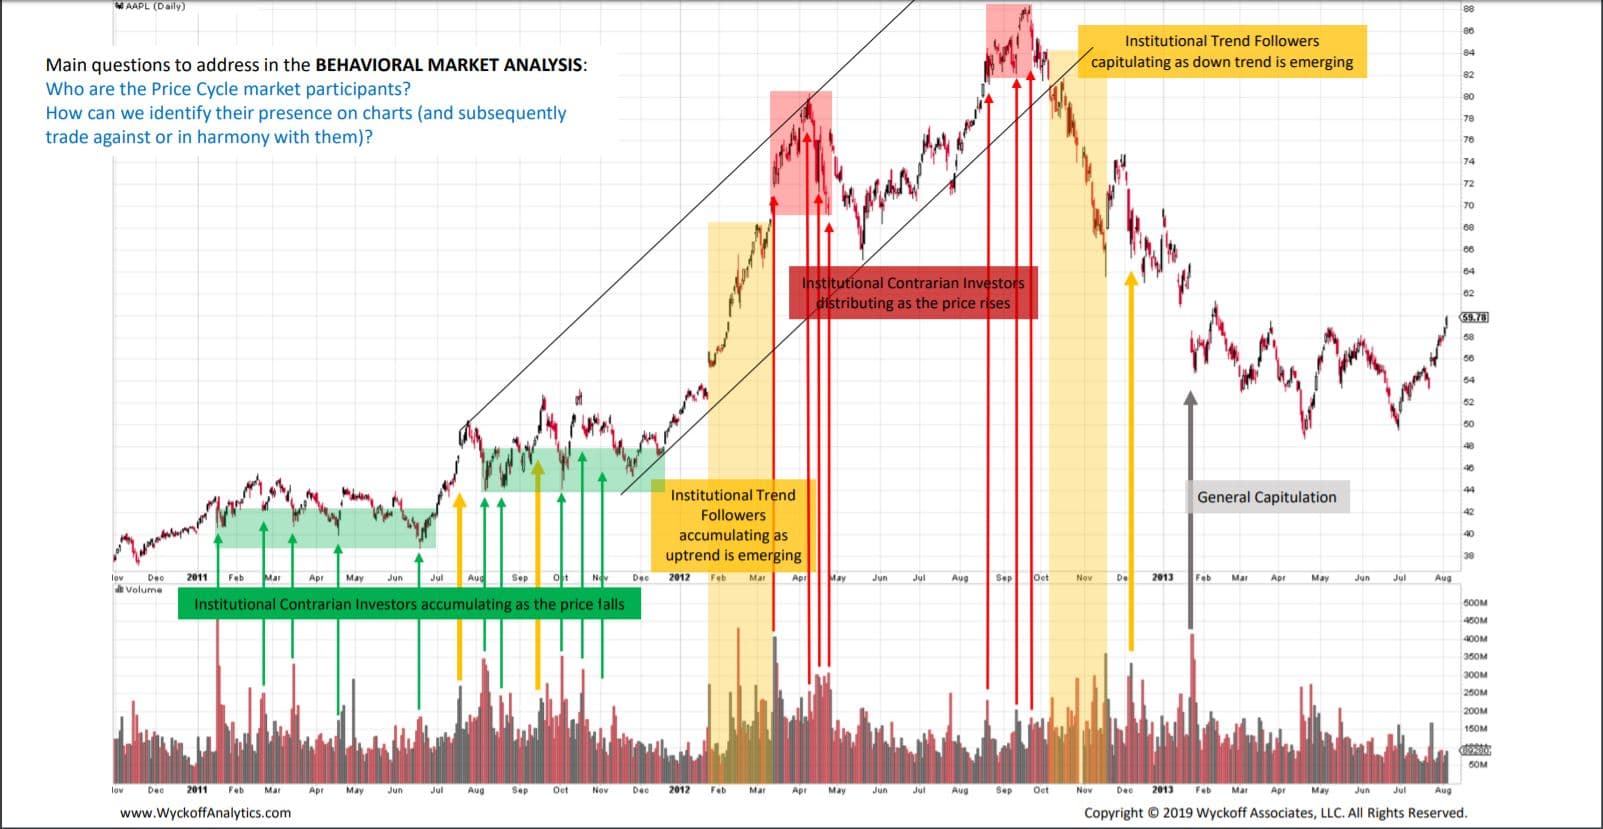
- The Market as a Discounting Mechanism and a visual representation of campaigns actions conducted by the Composite Operator (CO)
- Technical Analysis reveals the Discounting Mechanism. Definition. Long-term trend initiation, with catalyst(s) appearing later on.
- The Composite Operator as a heuristic for institutional participation
- Cyclicality vs the Price Cycle
- Technical Analysis Cyclicality. 3-5 year business cycle
- Business cycle corresponds with the market cycle
- Wyckoff Price Cycle: Accumulation, Mark-up, Distribution, Mark-down
- Trends and trading ranges within Price Cycle
- Price Cycle sequence: Accumulation, Mark-up, Re-accumulation, Mark-up, Distribution, Mark-down, Re-distribution
- Cyclicality of Price inside the channel
- Different time frames’ cyclicality and the Price Cycle
- Trading Range: Support/Resistance, Breakouts, Failed Breakouts, Upthrusts (UT) and Springs/Shakeouts(SO) or Signs of Strength (SOS)/Signs of Weakness(SOW)
- Technical Analysis: Trading ranges explained
- Technical Analysis: Support and resistance defined
- Technical Analysis: Breakouts and failed breakouts
- Wyckoff: Support and resistance defined
- Wyckoff: UT and Spring/SO as failed breakouts + SOS/SOW as successful breakouts
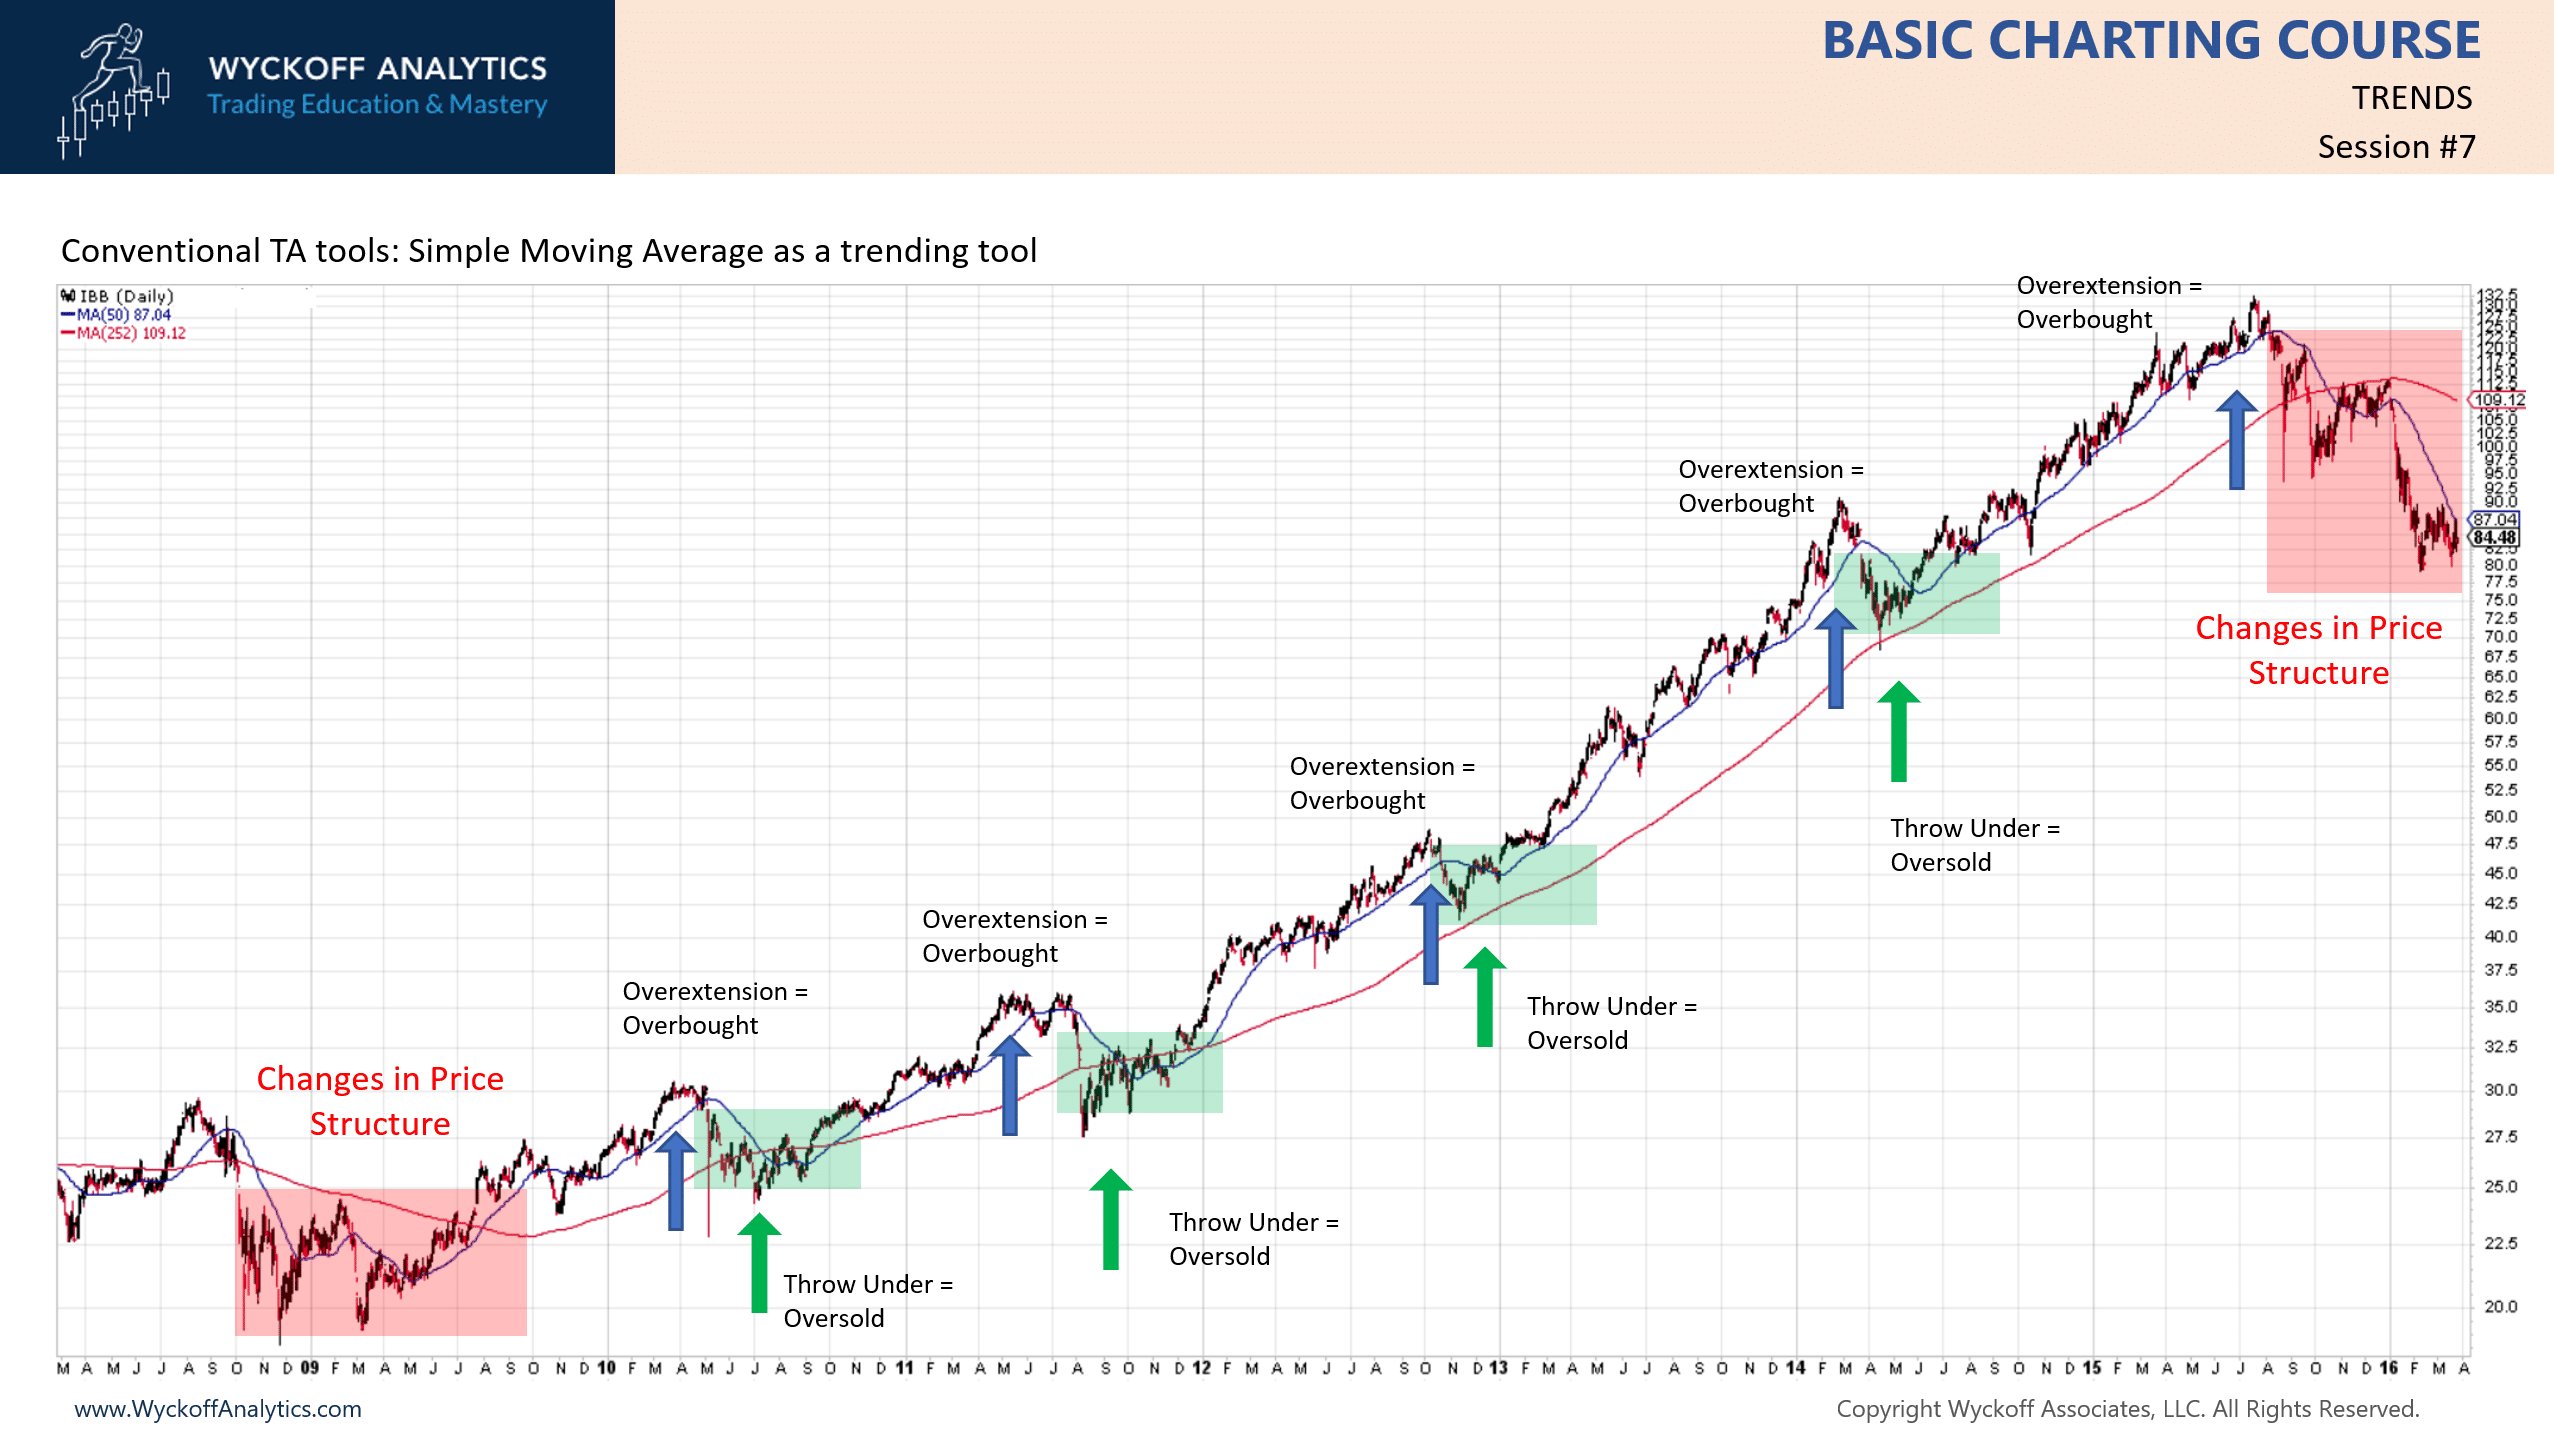
- Trends: Definition – Higher Highs(HH)/Higher Lows (HL). Logarithmic vs arithmetic scales. Moving averages (MA), Linear Regression Line (LRL)
- Technical Analysis: Trend Definition. HH/HL for uptrends and the reverse for downtrends
- Comparison of logarithmic vs arithmetic scaling
- Technical Analysis: Trend defined by TA tools (MA, Linear Regression Line)
- Wyckoff: Also HH/HL
- Trends: Conventional and Reverse Trendlines. Break of trendlines/Change of Character (ChoCh)
- Throw-overs and Oversold/Overbought conditions
- Break of Trendline signal. TA vs Wyckoff CHoCH
- Visuals: Multiple examples
- Price formations: Technical Analysis Patterns
- Reversal vs continuation patterns
- Trading ranges, including triangles, flags and pennants, wedges
- Triangles of different kinds compared with Wyckoff’s Hinge or Apex
- Head & Shoulders, inverse patterns, double tops and bottoms,
- Parabolic, V-formations or spikes
- Rounding top/bottom formations
- Wyckoff Price Formations: Accumulation
- Accumulation Events: Selling climaxes, secondary tests, springs, and others
- Accumulation Phases. Predictable sequences of Accumulation events
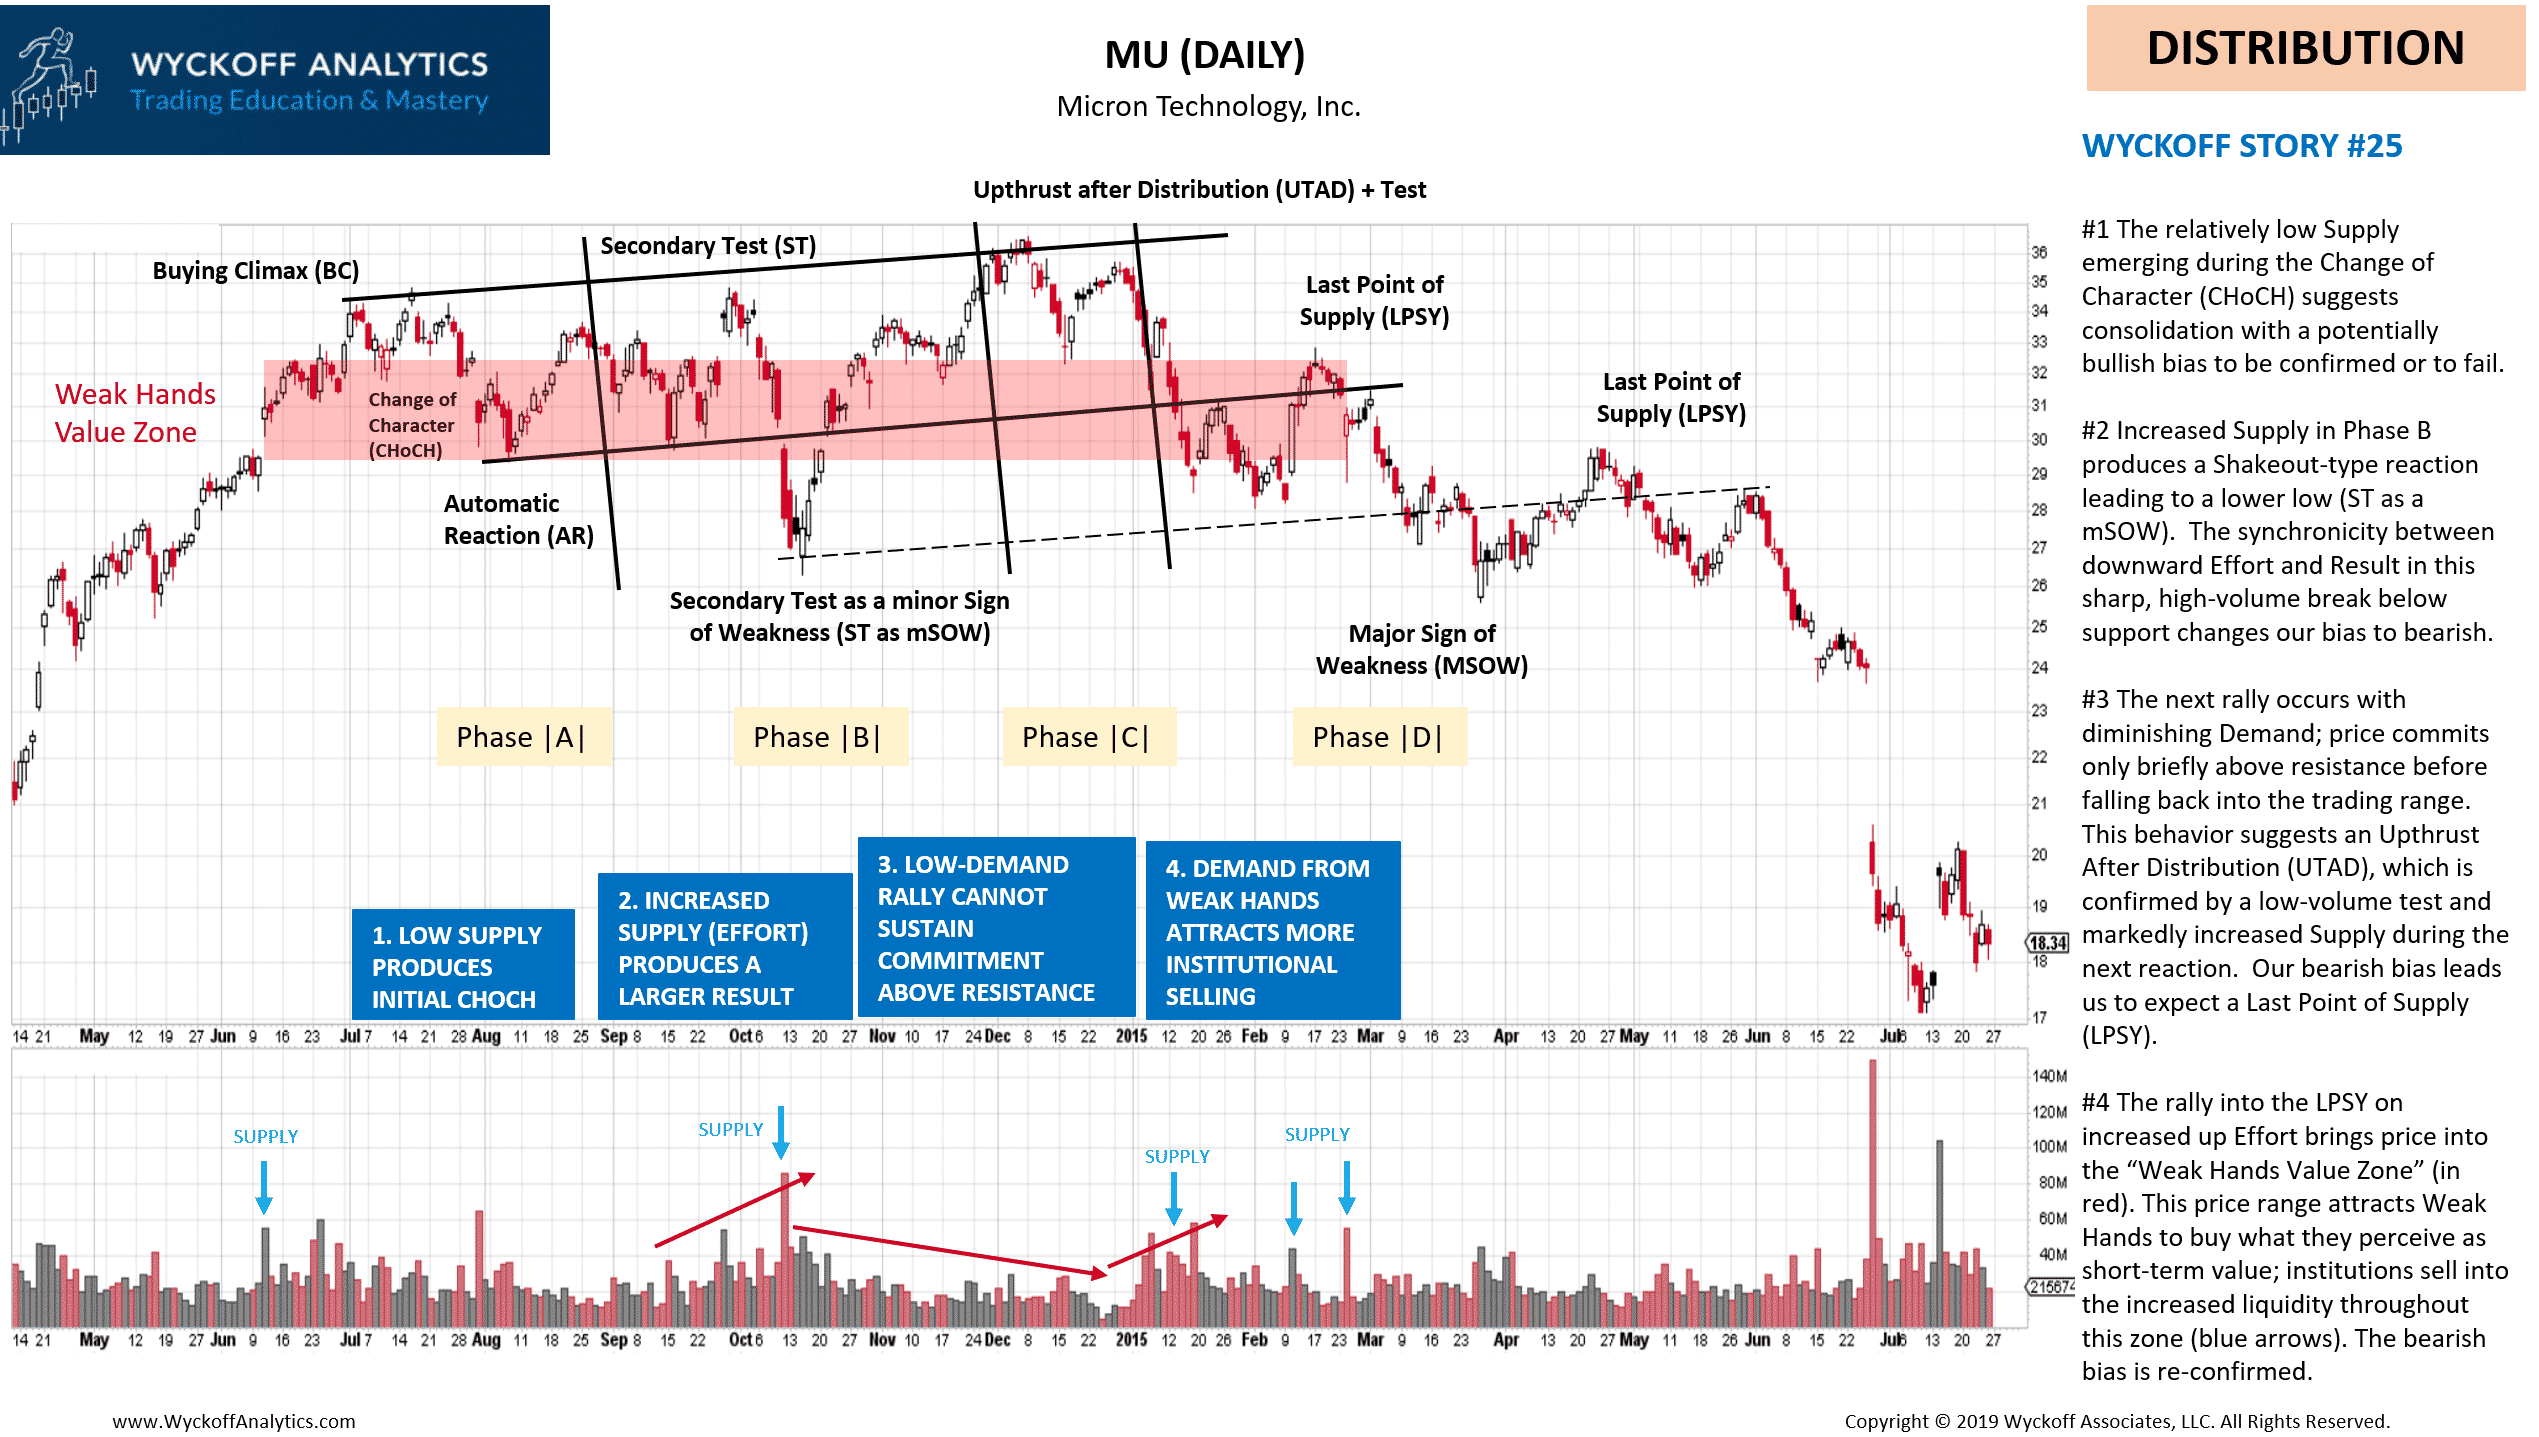
- Wyckoff Price Formations: Distribution
- Distribution Events. Buying climaxes, secondary tests, UTs, and others
- Distribution Phases. Predictable sequences of Distribution events
- Basic Technical Analysis definitions
- Volume leads price.
- Volume confirmation of price, with examples. Volume as evidence of Demand or Supply (or both).
- Volume divergence from price (non-confirmation), with examples.
- Wyckoff Laws: Supply and Demand
- Wyckoff’s Law of Supply and Demand drives the Price Cycle. Example: Exhaustion of Supply in a trading range leads to an uptrend.
- Case study: Price Cycle resulting from changes in Supply and Demand
- Wyckoff Laws: Effort vs. Result
- Effort vs. Results law. Definition.
- Result in line with Effort
- Non-confirmation. Result not in line with Effort.
- Wyckoff Comparative analysis
- Original Wyckoff Course comparative visuals
- Basic construction and interpretation
- Significant highs and lows + slope
- Issues with comparative analysis
- Relative Strength (RS) analysis
- Definition and basic construction
- Basic interpretation
- Heat Map ranking based on changes in RS
- Technical Analysis Indicators useful to Wyckoff Traders. Rate of Change (ROC), Relative Strength Index, Stochastics, and On Balance Volume (OBV)
- Volume: OBV
- Momentum: ROC
- Basic Technical Analysis P&F concepts (vertical measurements)
- One of the oldest charting methods
- P&F breakout patterns
- Vertical price objectives
- Wyckoff P&F Basics (horizontal counts)
- Wyckoff’s Law of Cause and Effect
- Basic horizontal counting guidelines to determine price targets
- 1-box (swing) vs 3-box reversal (campaign)
- Intraday P&F counts examples
- What’s next? Complimentary Wyckoff Trading Course 1st session + Wyckoff Market Discussion

Step 1: Watch the videos. You can binge-watch them OR you can review one session per day.
Step 2: Review the additional materials provided on the last slide of each presentation. These include “Wyckoff Power Charting” blogs, Chartschool articles and Youtube videos.
Our advice: Conclude each session – and the supplementary materials – with a sense of mastery before proceeding to the next. This approach will help you attain the deep knowledge needed to successfully apply these concepts to your trading.

What comes next?
The final video in this course includes links to complimentary sessions of the Wyckoff Trading Course (WTC) and our Wyckoff Market Discussion (WMD). The WTC gives traders the tools to analyze charts and execute trades using the Wyckoff Method. In the WMD, we analyze current markets – major U.S. indexes, sectors, industry groups and individual stocks – from a Wyckoff Method perspective, and demonstrate the utility of this approach in anticipating the future direction of any freely traded market.

Bruce Fraser, an industry-leading “Wyckoffian,” began teaching graduate-level courses at Golden Gate University (GGU) in 1987. Working closely with the late Dr. Henry (“Hank”) Pruden, he developed curriculum for and taught many courses in GGU’s Technical Market Analysis Graduate Certificate Program, including Technical Analysis of Securities, Strategy and Implementation, Business Cycle Analysis and the Wyckoff Method. For nearly three decades, he co-taught Wyckoff Method courses with Dr. Pruden, and has also used this approach to the markets as the foundation of his own trading for over 40 years. Bruce publishes a widely read blog at StockCharts.com, entitled “Wyckoff Power Charting” and co-hosts the popular, online weekly Wyckoff Market Discussion. Bruce has taught numerous special topic courses at Wyckoff Analytics including Mastering Long-Term Campaigns, Look Less, See More, Complete Wyckoff Point-and-Figure Charting, built from Part 1, Part 2 and Part 3, Point-and-Figure from Stocks to Cryptos, Practices For Successful Trading, Conversations With Wyckoff Wizards and the Basic Charting Course. Bruce co-taught with Joe Turner Trading Through the Business Cycle Part 1 and Trading Through the Business Cycle Part 2: Inflation Era. Bruce has also presented at the Best of Wyckoff Online Conferences in 2017, 2018, 2019, 2020, 2021, 2022, and 2023.

Roman Bogomazov is a trader and educator specializing in the Wyckoff Method of trading and investing, which he has taught for more than ten years as an Adjunct Professor at Golden Gate University and as the principal instructor at WyckoffAnalytics.com. He is the founder and President of Wyckoff Associates, LLC, an enterprise providing online Wyckoff Method education to traders throughout the world (www.wyckoffanalytics.com). Using WyckoffAnalytics.com as a thriving trading community platform, Roman has developed a comprehensive educational curriculum—from basic to advanced Wyckoff concepts, visual pattern recognition, and real-time drills—to enhance traders’ skills and confidence, and has also launched a highly sought-after advanced training module focused on elevating chart analysis and trading execution. A dedicated and passionate Wyckoffian, he has used the Wyckoff Method exclusively for his own trading for the last 30 years. Roman has also served as a Board Member of the International Federation of Technical Analysts and as past president of the Technical Securities Analysts Association of San Francisco.
Sign in to the website and the price presented on this landing page will display your discounted rate.

Email info@wyckoffanalytics.com with questions.
Foundational trading course
on chart reading and the Wyckoff Method: Analysis
Foundational trading course on the
Wyckoff Method: Execution
Weekly analyses of current markets

Important Disclaimer:
There is a very high degree of financial risk and loss involved in trading securities. You understand and acknowledge the existence of this risk and also that YOU ALONE ARE RESPONSIBLE FOR YOUR OWN TRADING AND INVESTMENT DECISIONS AND RESULTS. The materials presented and discussed in this online course are for educational purposes only; nothing contained therein should be construed as investment advice. Bruce Fraser and Roman Bogomazov (“Presenters”) are not registered investment advisors or broker-dealers and do not purport to recommend or suggest any specific trades or investments in stocks, bonds, e-minis, futures, options, currencies or any other financial instruments or markets. Presenters assume no responsibility or liability of any kind for your trading and investment results. It should not be assumed that any trades or investments described or discussed in this course were, are, or will be profitable.