Bitcoin Update: Swing Trading Strategy as Bitcoin Tests Resistance Levels
A technical analysis of Bitcoin’s current price action and strategic considerations as price targets are fulfilled
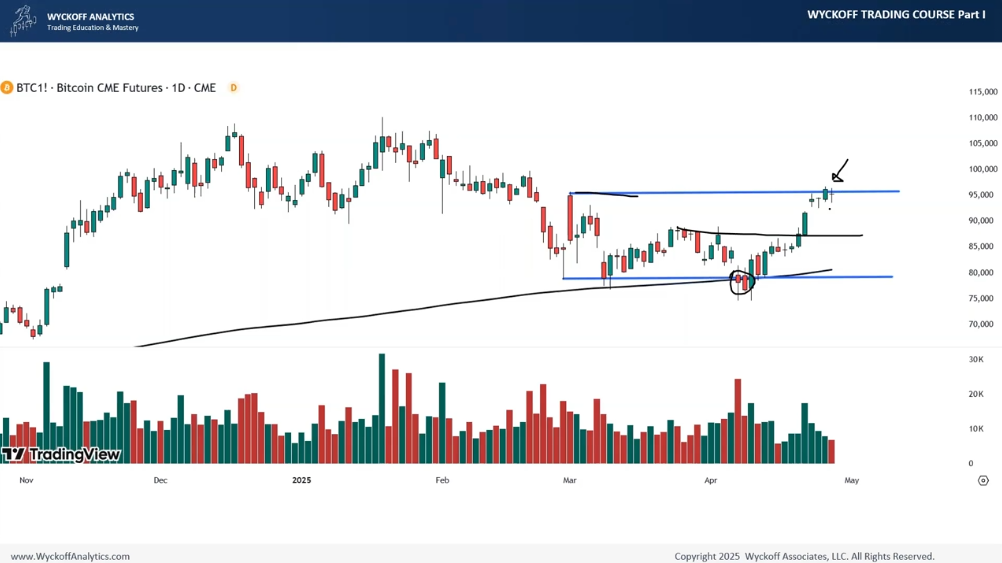
Point and Figure Target Reached
Bitcoin has reached an important milestone in its technical development. The Point and Figure (PnF) target that was previously identified has now been fulfilled. This represents a logical point to expect a pause in the upward momentum.
The CME Futures are particularly telling at this juncture, as they indicate there isn’t a substantial supply at the current resistance level. Our expectation from the spring setup was a test of this resistance level, with the possibility of reaching a second target. It’s encouraging to see that the complete target has been fulfilled.
It’s worth noting that we discussed this Bitcoin spring trade in real-time across various platforms, including Twitter classes.
Current Strategy Considerations
As Bitcoin tests these crucial resistance levels, the primary consideration for traders is volume analysis. The key observation is that you don’t want to see excessive volume at this stage. While today shows a down day, the supply signature remains relatively average, which is a positive signal.
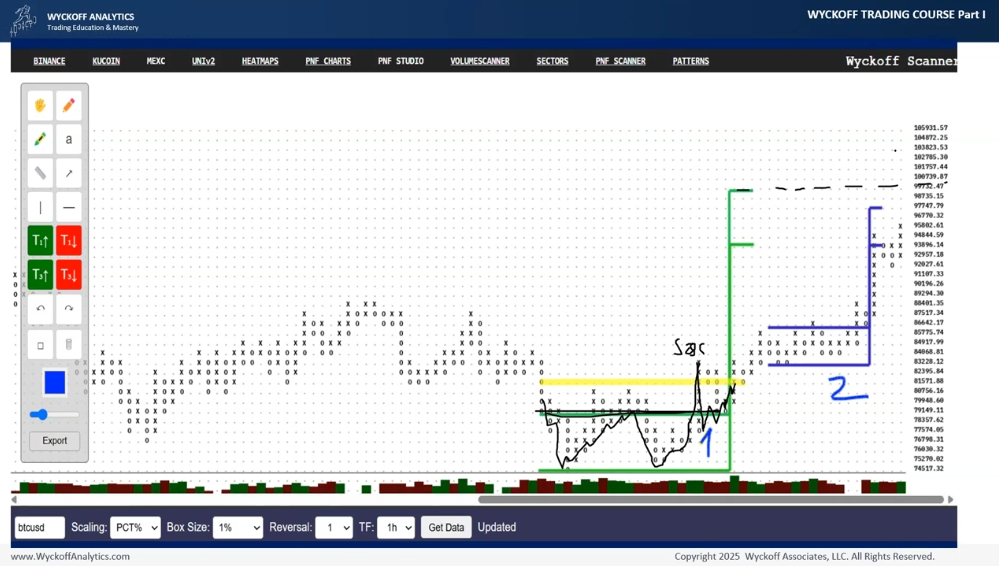
Point and Figure Chart Analysis
The one-hour time frame point and figure chart (using 1% box size) clearly illustrates the spring setup in action. The chart demonstrates a significant strength rally as Bitcoin tests resistance levels. This baking action allows us to take a count of the structure, yielding a substantial target below the psychologically important $100,000 level.
This $100,000 threshold represents a major psychological level for traders. Even reputable analysts frequently discuss the power and significance of these big round numbers in market psychology.
Identifying Trading Ranges
The point and figure chart reveals two distinct trading ranges:
- The original base
- A re-accumulation trading range
Notably, the target from this short-term swing point and figure chart points to almost the same area as our original analysis, falling slightly below the major target.
Strategic Decision Point
As experienced traders often advise: “Once the target of a point-and-figure chart is fulfilled, stop, look, and listen.” This doesn’t necessarily mean Bitcoin must retreat to support levels. Rather, following Wyckoff methodology, we should expect at least some deterioration of demand or new supply entering the market.
This juncture represents a critical moment for traders who initiated positions during the spring setup. Options include:
- Raising stop losses to protect gains
- Taking partial profits (approximately 30% of gains) on short-term trades
It’s important to remember that these shorter-term trades were not initiated with the goal of a long-term campaign, but rather with the specific intention of capturing the move to resistance.
Near-Term Outlook
The analysis suggests Bitcoin will likely continue to interact with the psychologically significant $100,000 level in the coming period. The critical factor to monitor will be how much supply emerges at this resistance level, as this will determine whether traders should:
- Exit positions completely
- Take partial profits
- Transition swing trades into longer-term positions
Conclusion
Bitcoin’s recent price action has fulfilled the predicted technical targets, creating a decision point for traders. The amount of supply that materializes at current resistance levels will be the determining factor in whether this remains a completed swing trade or becomes an opportunity to establish longer-term positions.
For traders who participated in the spring setup trade, this represents an ideal moment to evaluate position management strategies while closely monitoring supply and demand dynamics at these critical price levels.
This analysis is for educational purposes only.
UPCOMING CLASSES & EVENTS AT WYCKOFF ANALYTICS:

The Wyckoff Trading Course – Part 1 (Summer 2025):
The Wyckoff Trading Course (WTC) Part I offers a comprehensive education in the Wyckoff Method through 15 live sessions with recorded access.
This program teaches traders how to identify and follow institutional movements, anticipate market direction through price, volume, and time analysis without additional indicators, and “read the market” effectively. Students learn essential skills in three core areas:
- Price Structural Analysis (recognizing market cycles and institutional behavior)
- Supply and Demand Analysis (using volume-price relationships to predict market moves)
- Relative Strength Analysis (comparing instruments to identify optimal trading opportunities)
The course provides practical tools for trading alongside major institutions that drive market trends, with real-time market analysis and historical chart demonstrations.
Join our flagship Wyckoff Trading Course

The Wyckoff Trading Course – Part 2 (Summer 2025):
The Wyckoff Trading Course (WTC) Part II builds on foundational knowledge through 15 live sessions with recorded access for experienced students who have completed Part I.
This advanced program enhances traders’ pattern recognition and trade management capabilities through three core focus areas:
- Visual Recognition Skill “Practicum” (applying Wyckoff concepts through interactive exercises and drills)
- Advanced Wyckoff Analysis (deepening knowledge of phase behaviors, volume signatures, and trend recognition)
- Trading Tactics and Management (learning to visualize price structure scenarios, optimize entry/exit points, and implement risk management techniques)
The course emphasizes deliberate practice to help traders anticipate market direction, identify institutional players’ movements, and execute more profitable trades with greater confidence.
Students learn to select optimal trade candidates and use Wyckoff analysis alongside modern technical analysis tools for improved trading decisions.
Join the Wyckoff Trading Course – Part 2

Wyckoff Analytics Summer Training:
The Wyckoff Analytics Summer Training Course offers a 4-week introduction to professional trading techniques through four live interactive sessions led by experienced traders Roman Bogomazov and Tony Nguyen.
This program serves as a preview of their comprehensive Intraday and Swing Trading Program, helping traders develop a structured approach to market analysis.
Students learn essential skills in
- Process & Playbook Development (building a personalized trading framework)
- Post-Trade Analysis & Review (objective self-assessment)
- Technical Training (applying Wyckoff principles to identify trading opportunities)
- Simulation & Practice (risk-free application of skills).
The program creates a supportive learning environment where traders can learn from seasoned traders, develop disciplined decision-making processes, engage with a community of like-minded individuals, and gain practical experience that translates to real-world trading.
Join the Wyckoff Analytics Summer Training

Demystifying Position Sizing: Optimizing Risk And Reward:
The “Demystifying Position Sizing” course offers a transformative learning experience focused on optimizing risk and reward strategies with RJ Hixson, former Vice President at the Van Tharp Institute.
Students will learn four key components:
- The Missing Link to Profitability (understanding position sizing’s crucial role in achieving money objectives)
- Master R-Multiples (calculating and implementing risk measurement tools)
- Optimize Risk-Taking (using Expectancy and System Quality Number to inform decisions)
- Practical Position Sizing Strategies (implementing proven approaches that align with specific trading goals)
Join Demystifying Position Sizing: Optimizing Risk And Reward