Accumulation as an expression of Supply and Demand is the menu for the day! When we last me, we looked at Supply and Demand as it shifts during the beginning, middle and end of an accumulation. We looked at trends in price (a general, but not exclusive direction) as clues to the Supply-Demand relationship. Conditions of imbalance and equilibrium in Supply and Demand account for the movement of price or lack of movement (range bound). With the wind at our backs, lets look some the Supply-Demand relationships that provide scanning opportunities during accumulation.
Thinking in Three’s: Beginning, Middle and End.
When we look at accumulation as a structure, we can think of price movement within the structure as a three (3) act play: beginning, middle and end. The beginning of the structure is marked by a series of events that represent an initial change of character (“COCH 1”). For all structures, COCH 1 is what stops the prior movement of price. A change of character is just that—a change from what has gone before. Not only is a CHOC something different, but it also represents a transition to something new. All COCH moments are two-sided like a coin: change and transition.
The character of the prior trend is what distinguishes the nature of the structure. For example, all original accumulations (no, not re-accumulations) are preceded by a downtrend.
Let’s look at our accumulation schematic again:
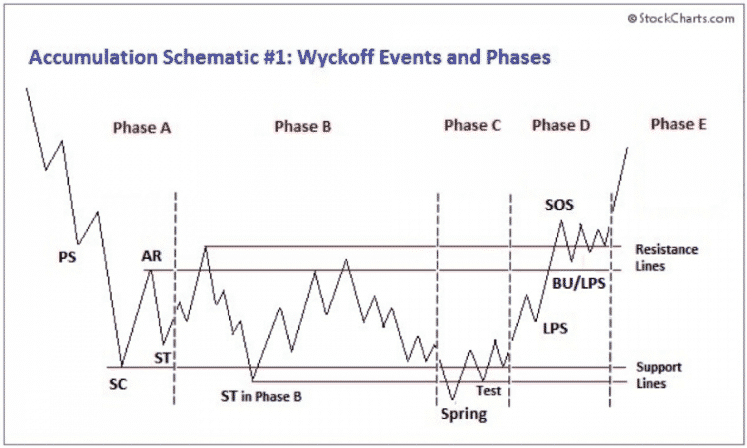
Our Type 1 Accumulation Schematic, shows us four (4) distinct steps at the beginning: 1. Preliminary Supply (“PS”); (2) Selling Climax (“SC”); 3 Automatic Rally (“AR”); 4 Secondary Test (“ST”). Collectively, these four elements form our “ideal” version of Phase A—the stopping phase (the “Phase A Accumulation Elements”).
Note that we use the term “ideal”. Why? Every structure reflects the stock being traded and the market participants who trade the instruments. Variation in structures is as multiplicitous (sorry, legal jargon) as the snowflakes.
Take a minute and think about the Supply Demand characteristics of each Phase A accumulation element. Yes, we all also know that spread, tails, volume, etc. often play critical roles in identifying Phase A accumulation elements. However, just paint with a broad brush for a moment and think, for example, about what Supply and Demand had to be doing to create a chart feature such as an SC. Think a bit further into Phase A and think about what Supply and Demand were doing to create and SC, AR and ST—all in succession.
Now take another look at our Accumulation Arrow Schematic and think about the three acts in our play:
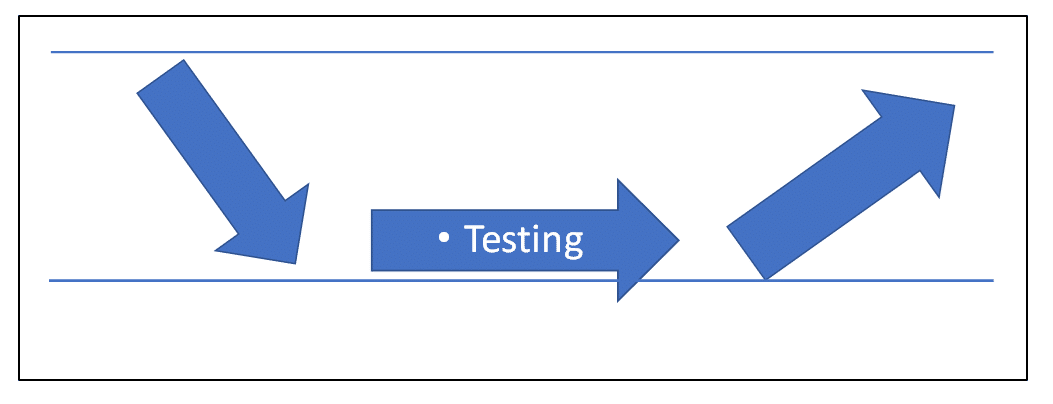
As much as Supply and Demand move price to create a three (3) act play within an accumulation structure, think about how Supply and Demand interact with each other during each of these acts. In act 1 (Phase A), Supply overwhelms demand on the way in (although there is often a glimmer of hope through the PS) and then something happens to stop price from going down. The second act is a period of testing that can thrash between support (demand exceeds supply) and resistance (supply exceeds demand). Our third act starts with a second change character (“COCH 2”), which may itself start with a bang (a/k/a spring). COCH 2, begins the structural area identified as Phase C. Phase C is a point at which (a) we change from a testing phase; and (b) transition to a rising price period in which Demand generally overcomes Supply. With any luck, we are off to the races in Phases D and E as price is carried up and out of the accumulation structure.
Now that we have some more perspective on accumulation, how can we scan for a structure that might represent accumulation. Here are some things we might need:
- A prior down trend;
- Stopping action that changes character from the prior trend and transitions to testing;
- A period of testing that bounces between areas (not exact lines, but ranges) of support and resistance; and
- A second change of character that changes from testing and transition to a rising price environment.
For next time, think of how you might develop scan syntax the identifies stocks that have completed their first change (COCH 1) and transitioned to their second act (testing). Hold off on COCH 2 and the third act for now.
Coming Up.
Next time we will look at some scan code that gives us a look at stocks that might be entering or in accumulation.
See you next time.
Scan well, trade better!