S&P Update: Short-term Bottom in Play?
The recent price action in the S&P suggests we might be approaching a short-term bottom, with volume spread analysis indicating potential demand entering the market. Let’s analyze the current situation and what it could mean for short sellers.
When examining today’s bar, there’s a notable volume signature that immediately brings to mind a previous pattern in the market. This earlier pattern occurred during an oversold condition, similar to where we are now. The volume characteristics between these two periods appear remarkably alike, suggesting a potential rhyme in market behavior.
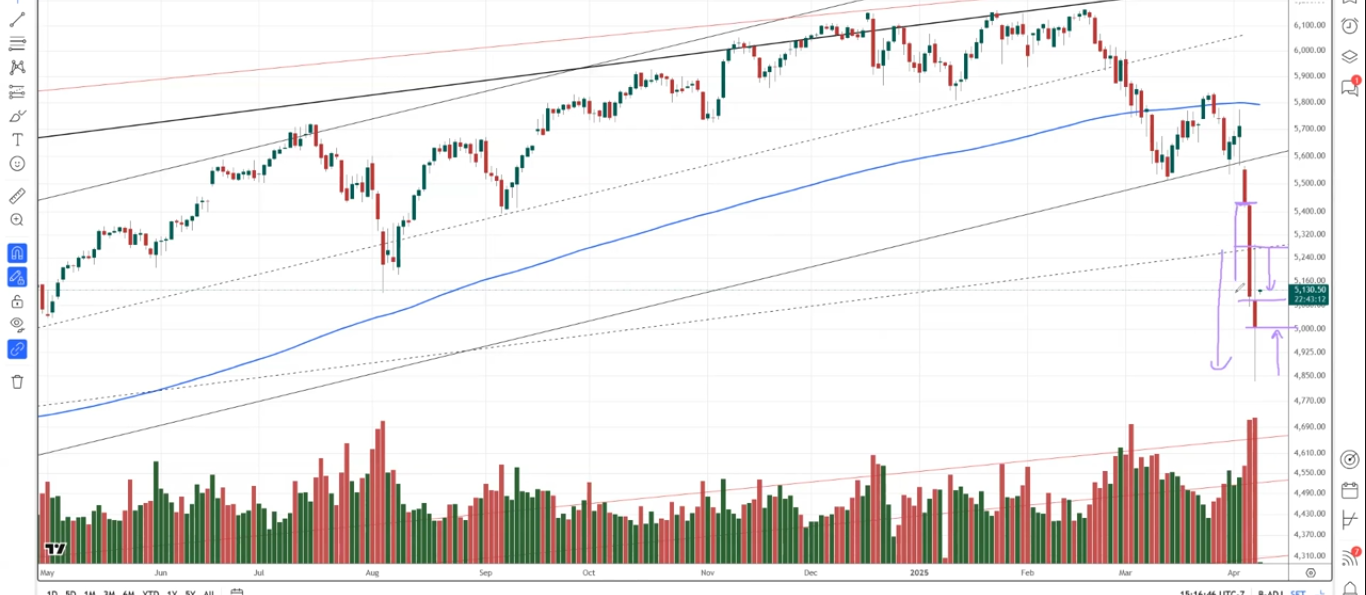
What stands out most prominently is the spread of today’s bar compared to yesterday’s. The body of today’s candle shows a dramatic expansion—approximately three times the previous body—while maintaining a similar volume signature. This disproportionate relationship between price movement and volume is significant.
This spread-to-volume relationship often points to hidden demand in the market. The presence of such substantial demand doesn’t guarantee an immediate rally, but it does suggest underlying strength that could manifest in upcoming sessions.
Looking at the immediate bar following the previous similar demand pattern, we can observe an improvement in the demand tail. This improvement isn’t subtle—it represents an increase by a factor of approximately five. Such a tail often represents rejected attempts to push prices lower, further supporting the case for underlying demand.
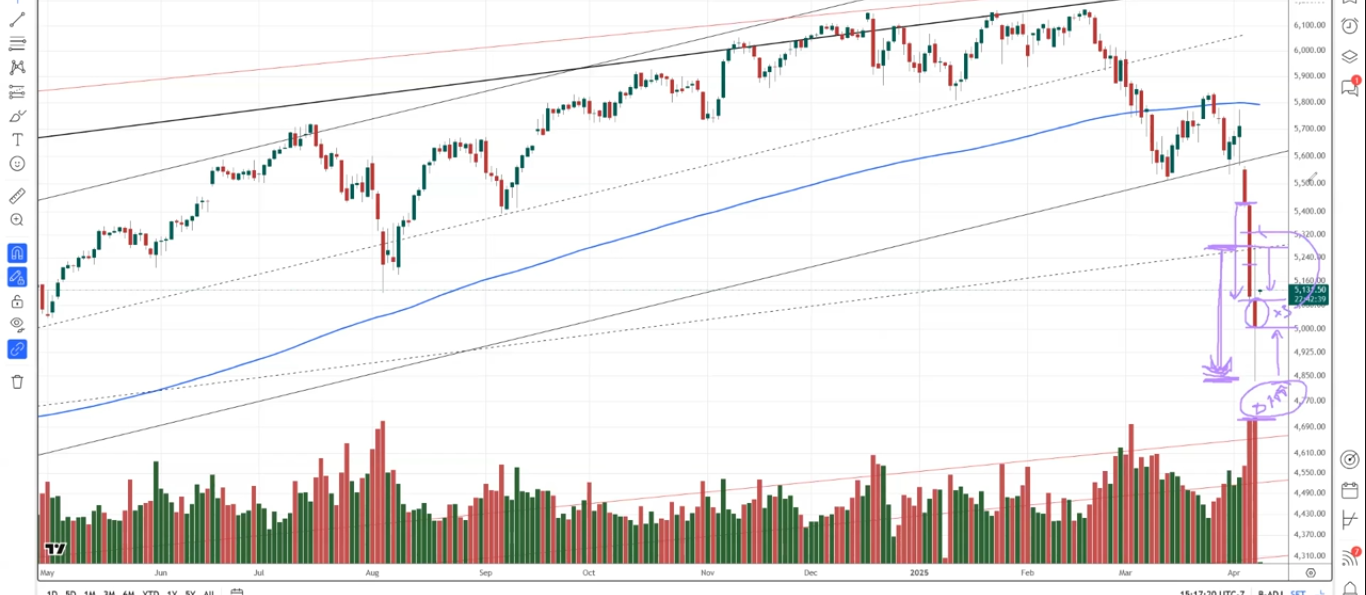
For short sellers, this technical setup presents a potentially vulnerable situation. If the volume spread analysis proves accurate, they may face a sharp bounce that could trigger covering, further accelerating any upward movement.
The consolidation phase we’re currently experiencing might require more time to fully develop before a clearer direction emerges. While the demand signals are present, markets rarely move in straight lines, and patience may be required as the pattern completes its formation.
The key level to watch appears to be the reaction zone from the previous similar pattern. If prices respect this area, it could confirm the validity of the comparison and strengthen the case for a short-term bottom being established.
In summary, the current market structure in the S&P displays classic volume spread analysis signals of accumulation. The dramatically expanded spread on similar volume, combined with improving demand tails, suggests hidden buying pressure despite recent weakness. While this doesn’t guarantee immediate upside, it does provide a framework for understanding the current consolidation phase and potential scenarios for what might follow.
UPCOMING CLASSES & EVENTS AT WYCKOFF ANALYTICS:

The Wyckoff Trading Course – Part 1 (Summer 2025):
The Wyckoff Trading Course (WTC) Part I offers a comprehensive education in the Wyckoff Method through 15 live sessions with recorded access.
This program teaches traders how to identify and follow institutional movements, anticipate market direction through price, volume, and time analysis without additional indicators, and “read the market” effectively. Students learn essential skills in three core areas:
- Price Structural Analysis (recognizing market cycles and institutional behavior)
- Supply and Demand Analysis (using volume-price relationships to predict market moves)
- Relative Strength Analysis (comparing instruments to identify optimal trading opportunities)
The course provides practical tools for trading alongside major institutions that drive market trends, with real-time market analysis and historical chart demonstrations.
Join the FREE session of our flagship Wyckoff Trading Course

The Wyckoff Trading Course – Part 2 (Summer 2025):
The Wyckoff Trading Course (WTC) Part II builds on foundational knowledge through 15 live sessions with recorded access for experienced students who have completed Part I.
This advanced program enhances traders’ pattern recognition and trade management capabilities through three core focus areas:
- Visual Recognition Skill “Practicum” (applying Wyckoff concepts through interactive exercises and drills)
- Advanced Wyckoff Analysis (deepening knowledge of phase behaviors, volume signatures, and trend recognition)
- Trading Tactics and Management (learning to visualize price structure scenarios, optimize entry/exit points, and implement risk management techniques)
The course emphasizes deliberate practice to help traders anticipate market direction, identify institutional players’ movements, and execute more profitable trades with greater confidence.
Students learn to select optimal trade candidates and use Wyckoff analysis alongside modern technical analysis tools for improved trading decisions.
Join the FREE session of the Wyckoff Trading Course – Part 2

Wyckoff Analytics Summer Training:
The Wyckoff Analytics Summer Training Course offers a 4-week introduction to professional trading techniques through four live interactive sessions led by experienced traders Roman Bogomazov and Tony Nguyen.
This program serves as a preview of their comprehensive Intraday and Swing Trading Program, helping traders develop a structured approach to market analysis.
Students learn essential skills in
- Process & Playbook Development (building a personalized trading framework)
- Post-Trade Analysis & Review (objective self-assessment)
- Technical Training (applying Wyckoff principles to identify trading opportunities)
- Simulation & Practice (risk-free application of skills).
The program creates a supportive learning environment where traders can learn from seasoned traders, develop disciplined decision-making processes, engage with a community of like-minded individuals, and gain practical experience that translates to real-world trading.
Join the Wyckoff Analytics Summer Training

Demystifying Position Sizing: Optimizing Risk And Reward:
The “Demystifying Position Sizing” course offers a transformative learning experience focused on optimizing risk and reward strategies with RJ Hixson, former Vice President at the Van Tharp Institute.
Students will learn four key components:
- The Missing Link to Profitability (understanding position sizing’s crucial role in achieving money objectives)
- Master R-Multiples (calculating and implementing risk measurement tools)
- Optimize Risk-Taking (using Expectancy and System Quality Number to inform decisions)
- Practical Position Sizing Strategies (implementing proven approaches that align with specific trading goals)
Join Demystifying Position Sizing: Optimizing Risk And Reward